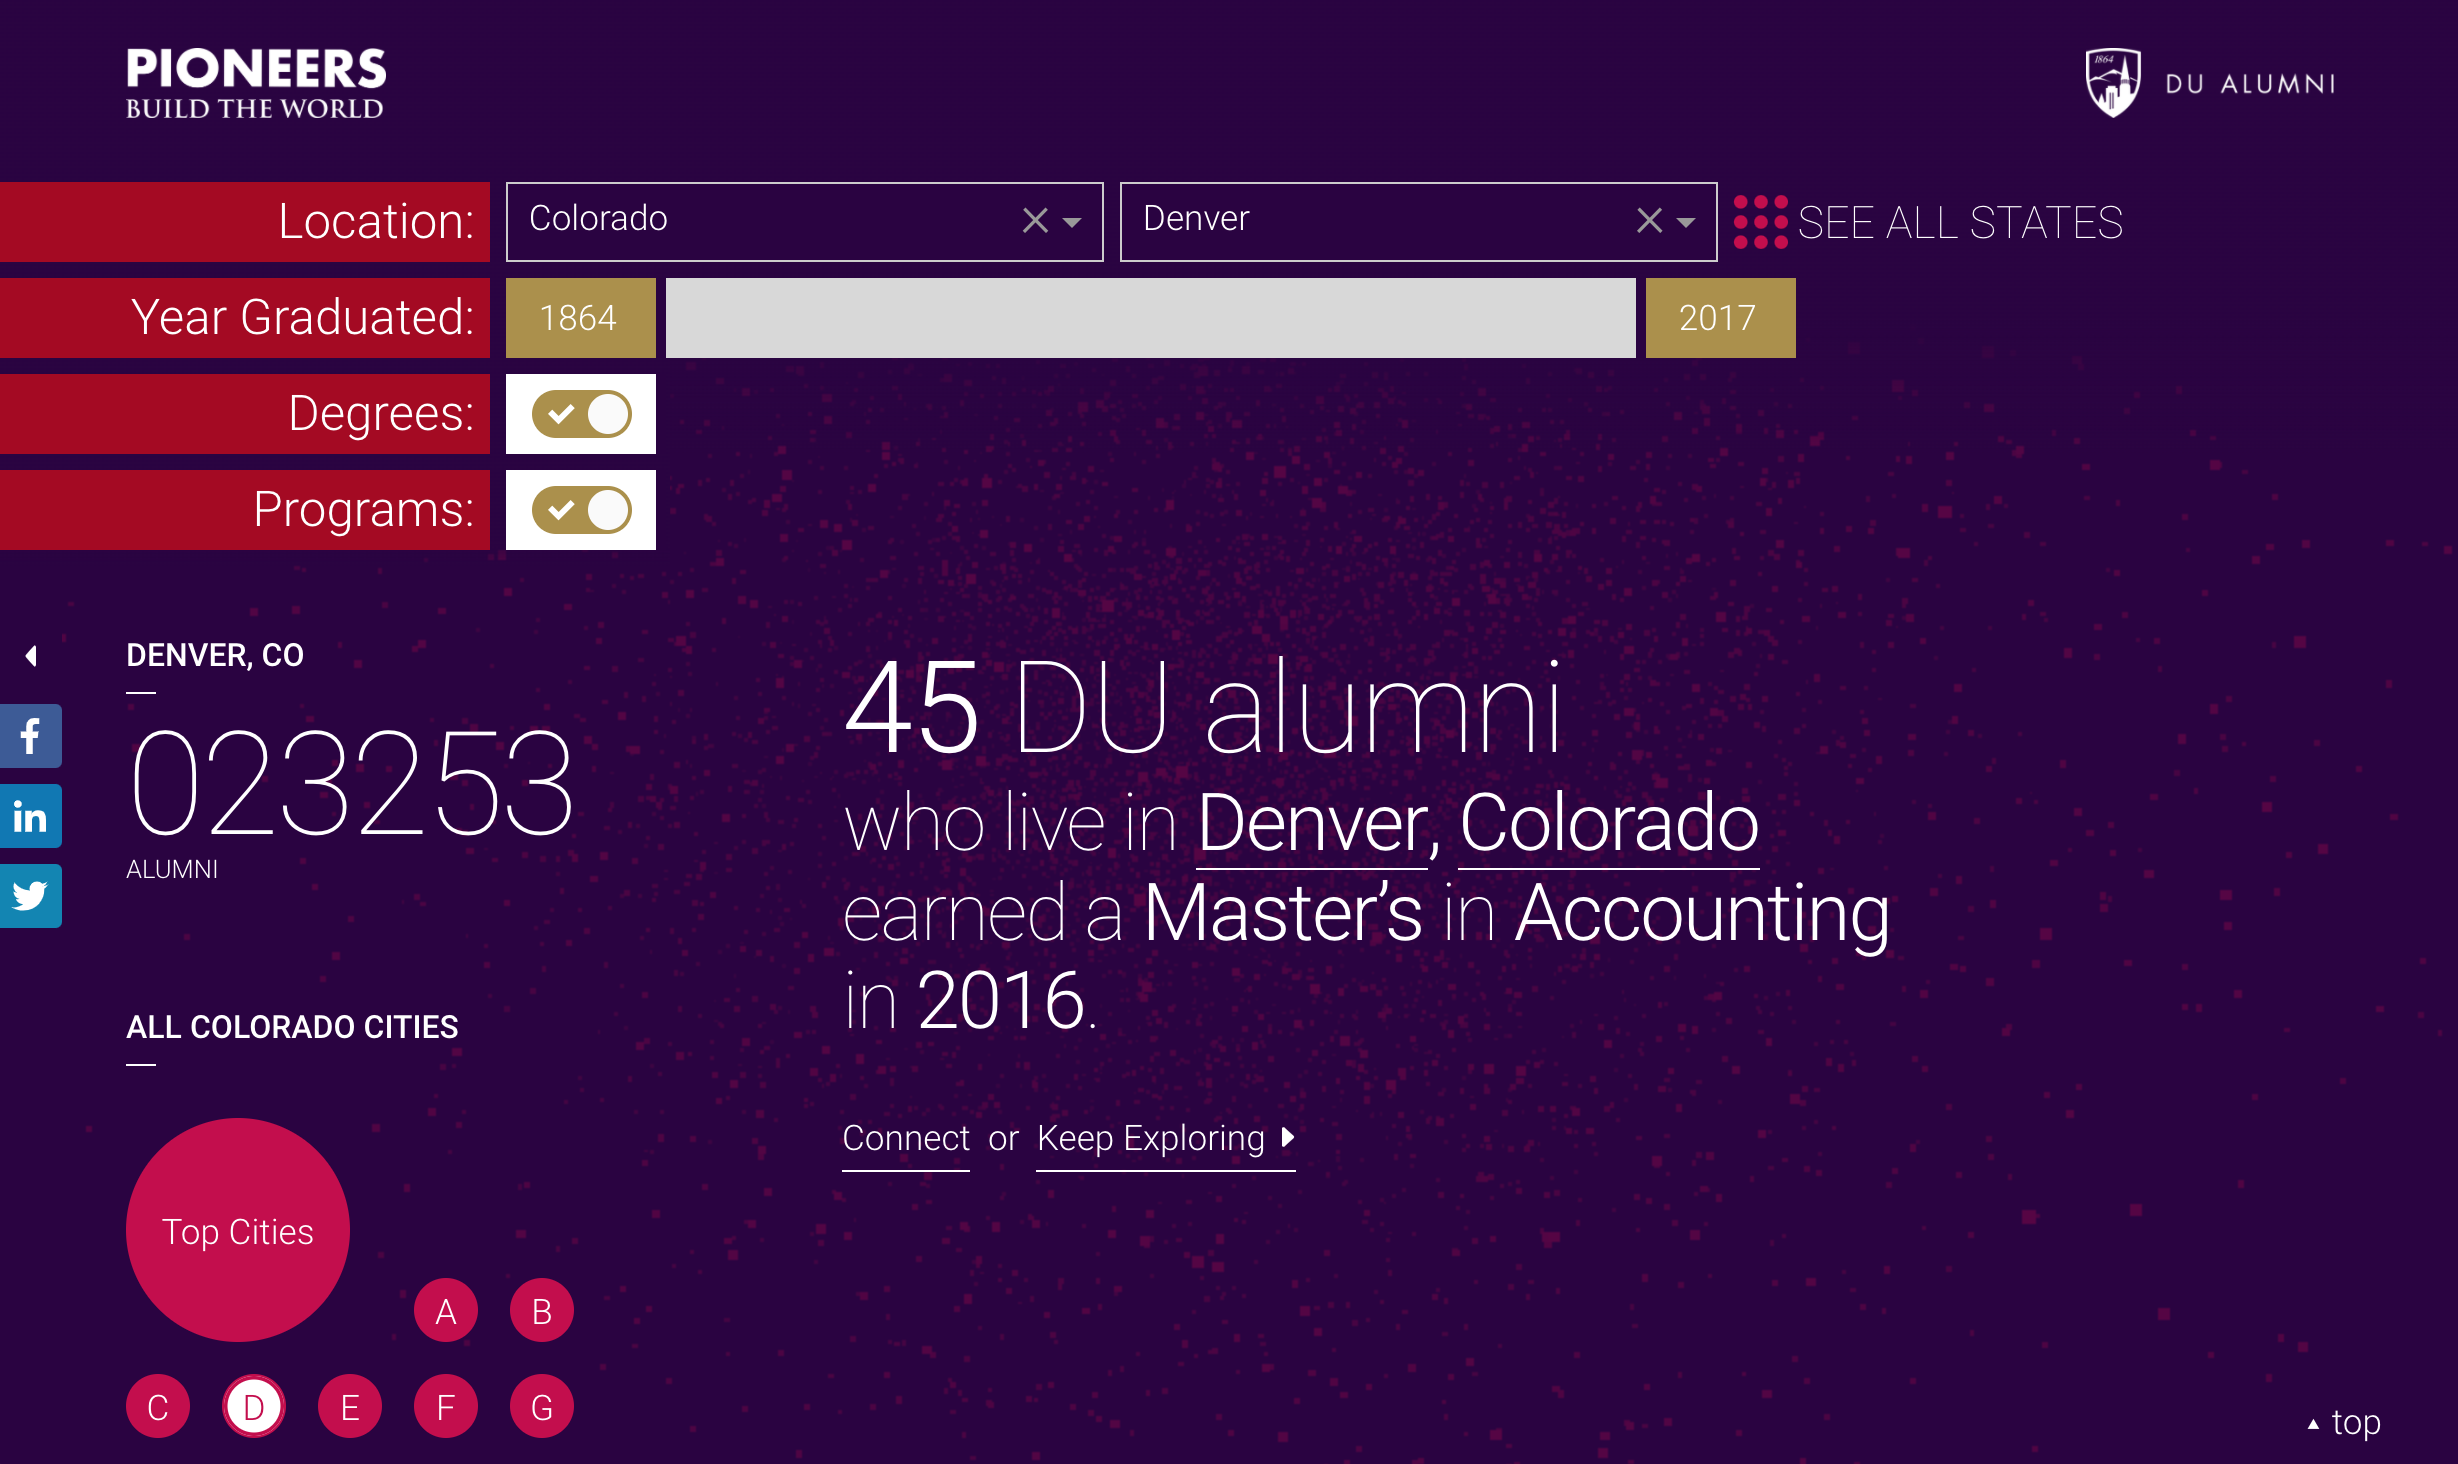
Project type: Web App // Client: University of Denver // Employer: Smashing Boxes
THE CHALLENGE
“My college just wants a donation”
Continuing a connection with alumni after graduation can provide a valuable form of support to higher education institutions. But maintaining that relationship can prove more difficult over time. If you don’t give them a good reason to pay attention, a college’s correspondence is usually assumed to be an ask for money which in turn causes alums to tune out. Our mission: inspire disengaged alumni to reconnect with the university.
With email marketing campaigns proving less effective, The University of Denver Alumni Association was looking for a disruptive product, something that could break through the noise and attract alumni who were completely disengaged from DU’s alumni association. We were charged to come up with a way to use over 100 years of alumni data to tell a story that would represent the university’s spirit, sense of innovation, and capture at least a little attention from a disengaged audience.
MY ROLE ON THIS PROJECT
Understand: Discovery research
Analyze: Opportunity statements, design synthesis (research summary)
Design: Sketching exercises, design workshops, user flows, high-fidelity prototyping, user design critique, design system, UI and interaction design
Validate: Facilitated user testing sessions
Discovery
During the discovery phase, we interviewed and worked closely with the client and DU database administrators to unearth and organize all the available data. We realized by using de-identified data from the university alumni database, we could show the expansive reach of the university and its alums without compromising privacy.
On its own, data doesn’t have a voice. It’s just points of information.
Rather than simply listing the facts, we wanted to make the data relatable, compelling and visual. Wrapping the data around a story helped bring it to life. It gave mundane data points new meaning with the ability to tell a story about the university’s impact and connection to thousands of communities around the country. Pioneers Build the World.
With insights in hand, we set out to do some sketching. Our process was to sketch in collaboration with the client, sharing and critiquing as we went along.
Data Visualization
We wanted to give alums an engaging way to see the distribution of data over a geographical region and compare proportions of alums over multiple cities and states. The data used connected university alums by graduation date, location, degree earned and program.


